inki

Wireless information displays for modern spaces
Time-series data visualization - inki-historian
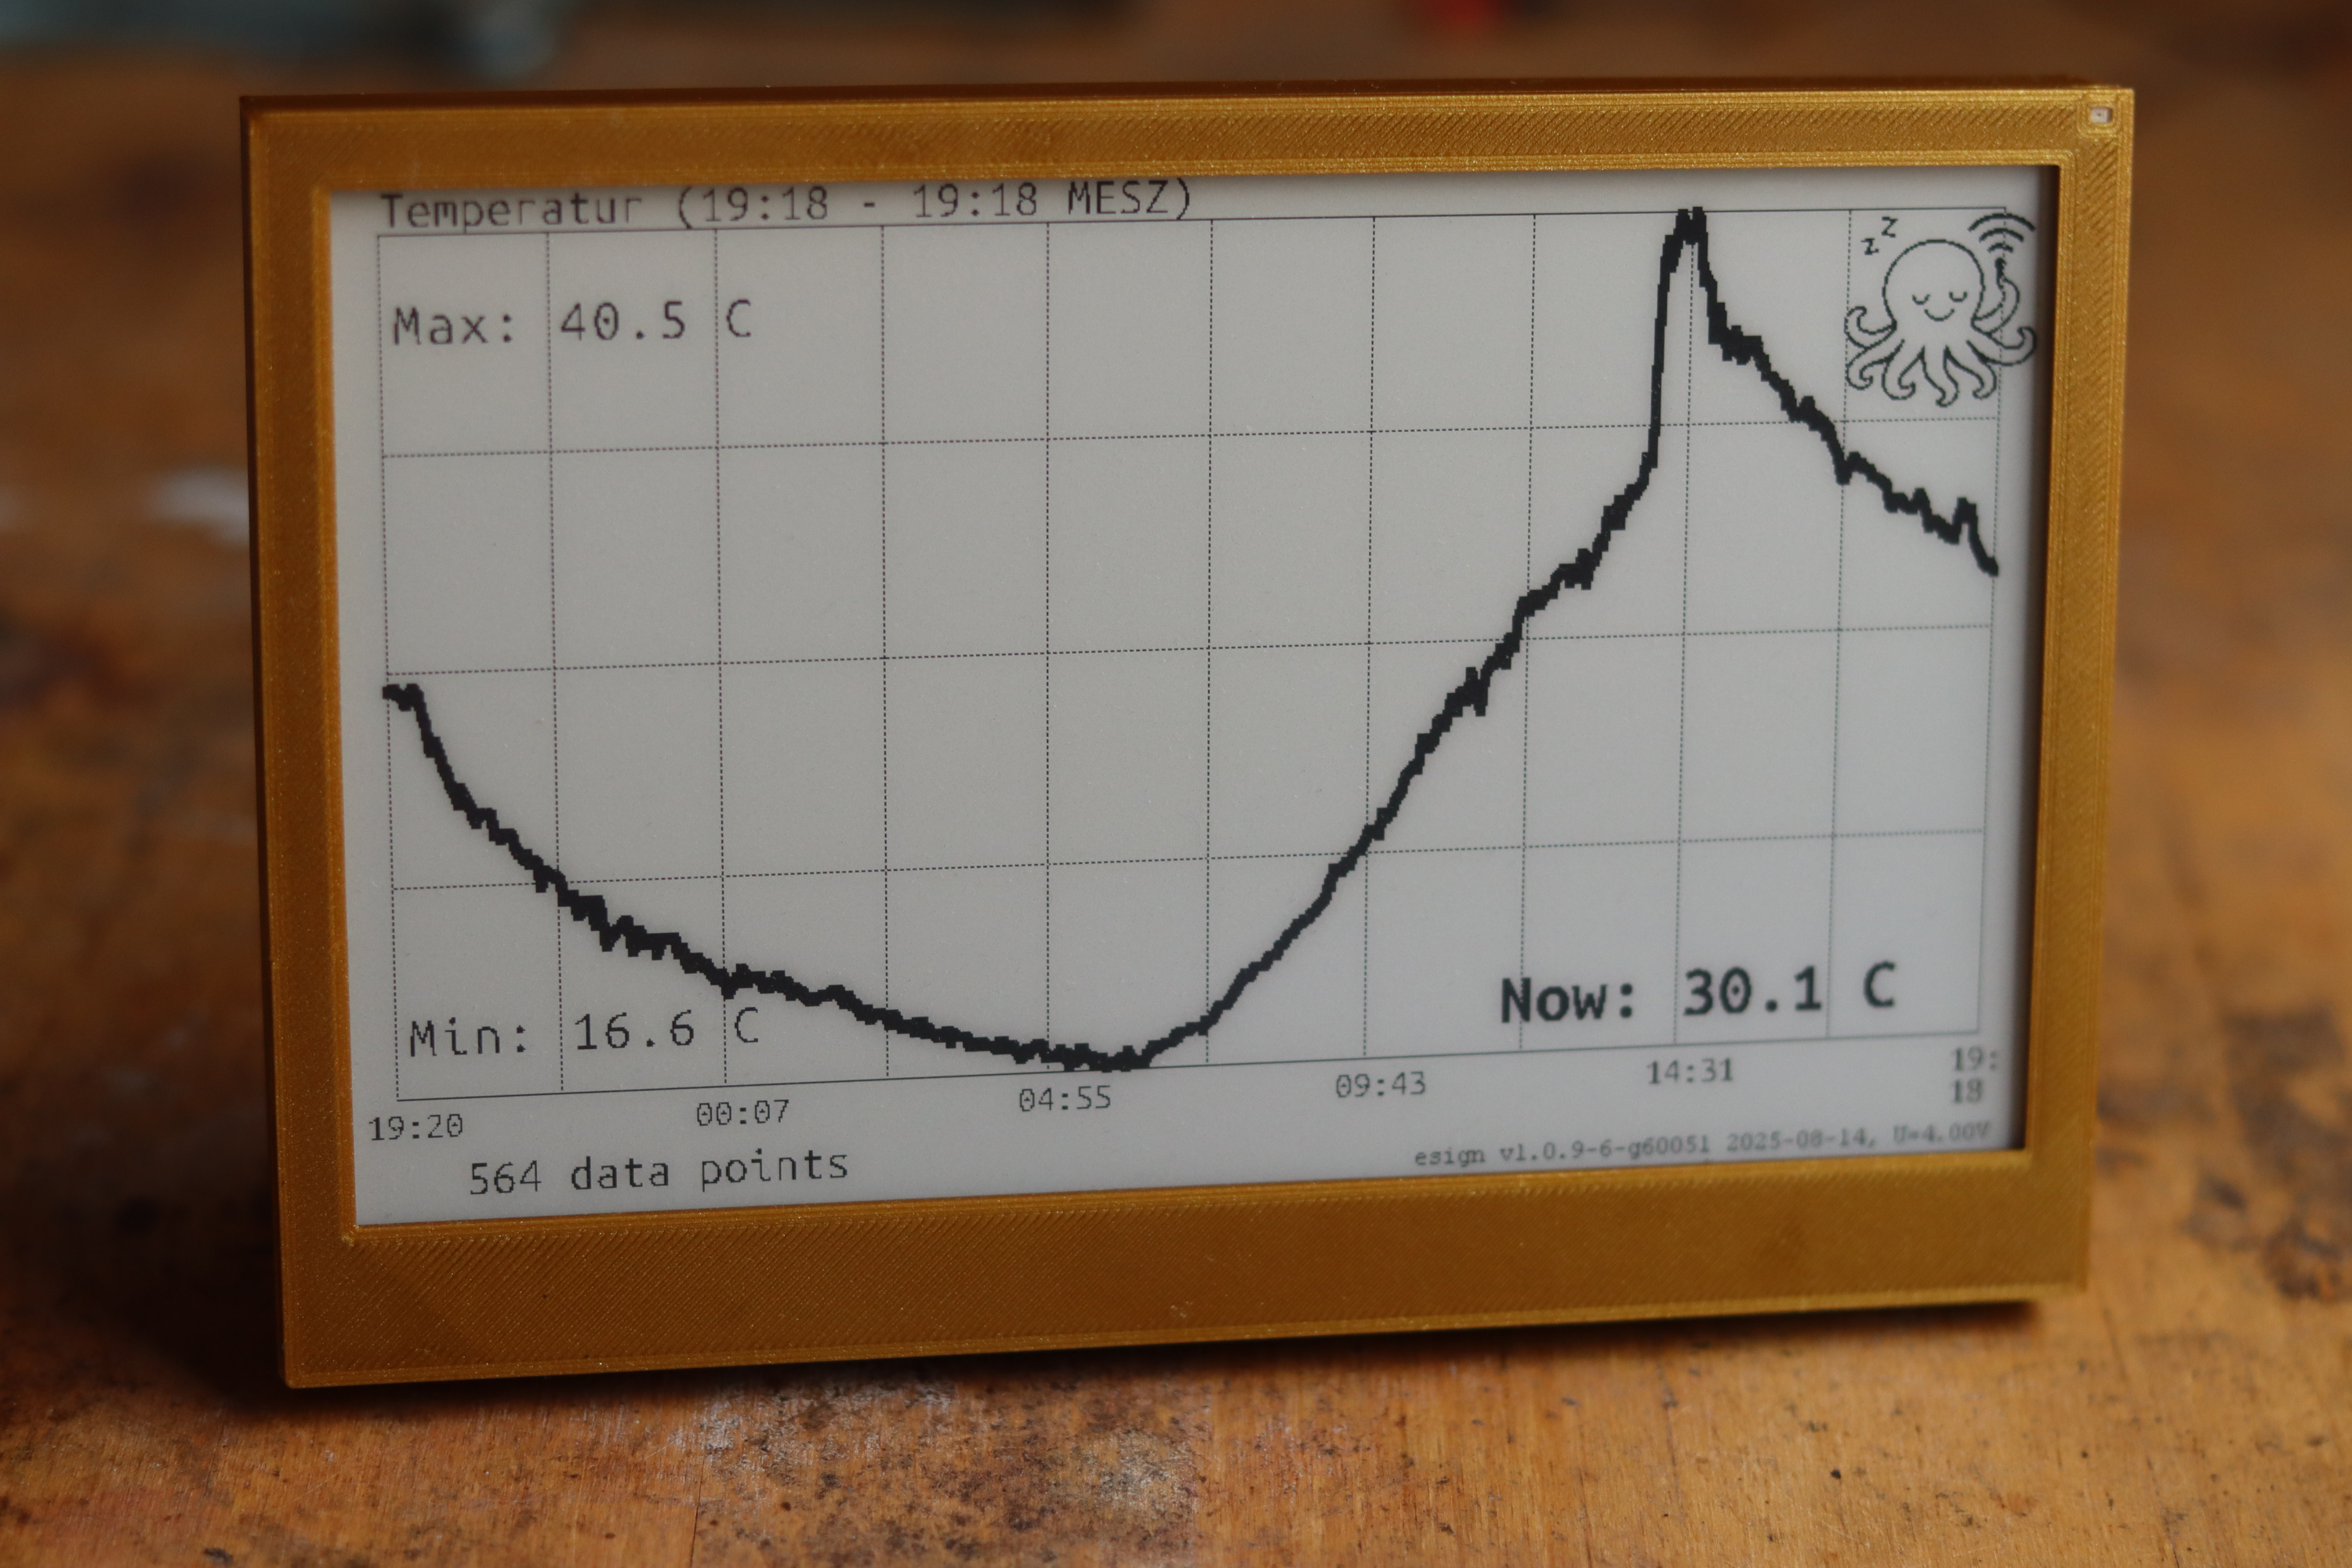
Temperature progression of a Homematic sensor in our garden over the last 24 hours
Overview
In home automation systems you often have quite a lot of constantly changing and interesting data. Of course, you can look it up in your favorite web interface. However, it might be nice to have this automatically happen, and have a attractive “electronic picture” on your wall that you can briefly look at in your all-days routine. Above you see the 7.5” version of inki displaying the temperature in our garden from the ccu-historian home automation system from the last 24 hours, and the gas consumption in our home. It is quite fun to see the dynamics this way.
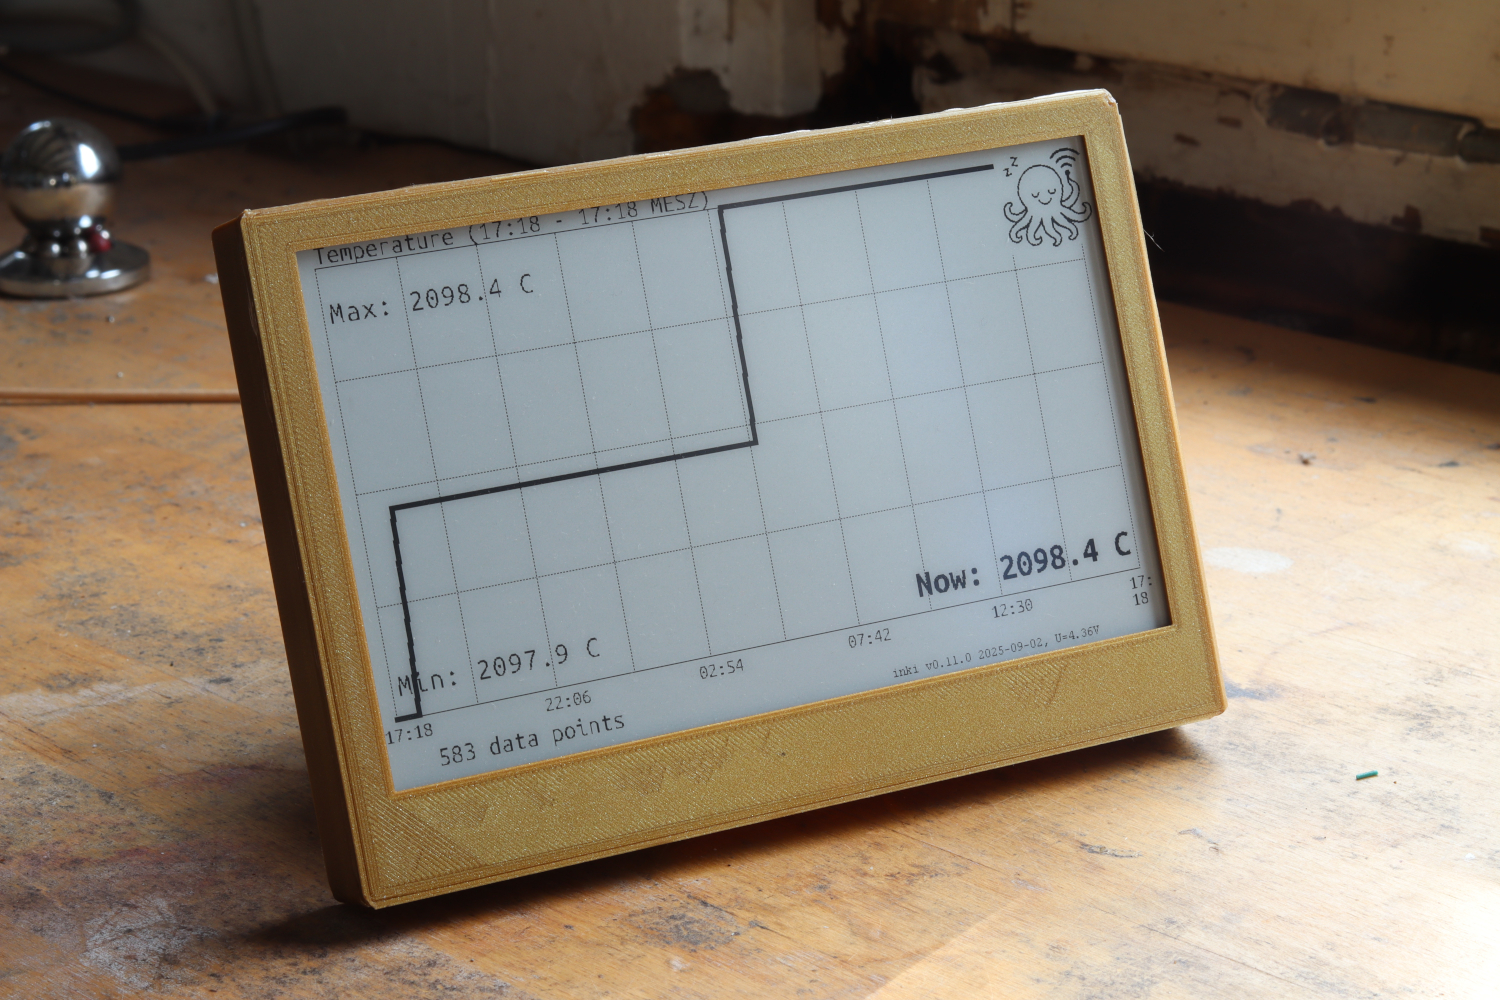
Gas consumption of our heating system - as hoped for in summer, very little gas is consumed
The Historian use case connects inki to CCU-Historian servers to display time-series sensor data with trend analysis and historical visualizations. We build on and integrate with the CCU-Historian project to provide wireless ePaper visualization of your home automation data. In general any data from CCU-Historian can be fetched and displayed, below are a few examples.
Example and Features
- Temperature sensor monitoring with graphical trend display
- Home heating gas consumption tracking and visualization
- Automatic data retrieval from CCU-Historian via API calls
- Ultra-low power operation with ~10,000 queries per battery set
- Wireless configuration via web interface with WiFi setup
Configuration & Setup
Once your inki device is powered on and connected, you’ll access the web interface to configure your historian settings. Here’s what the actual interface looks like:
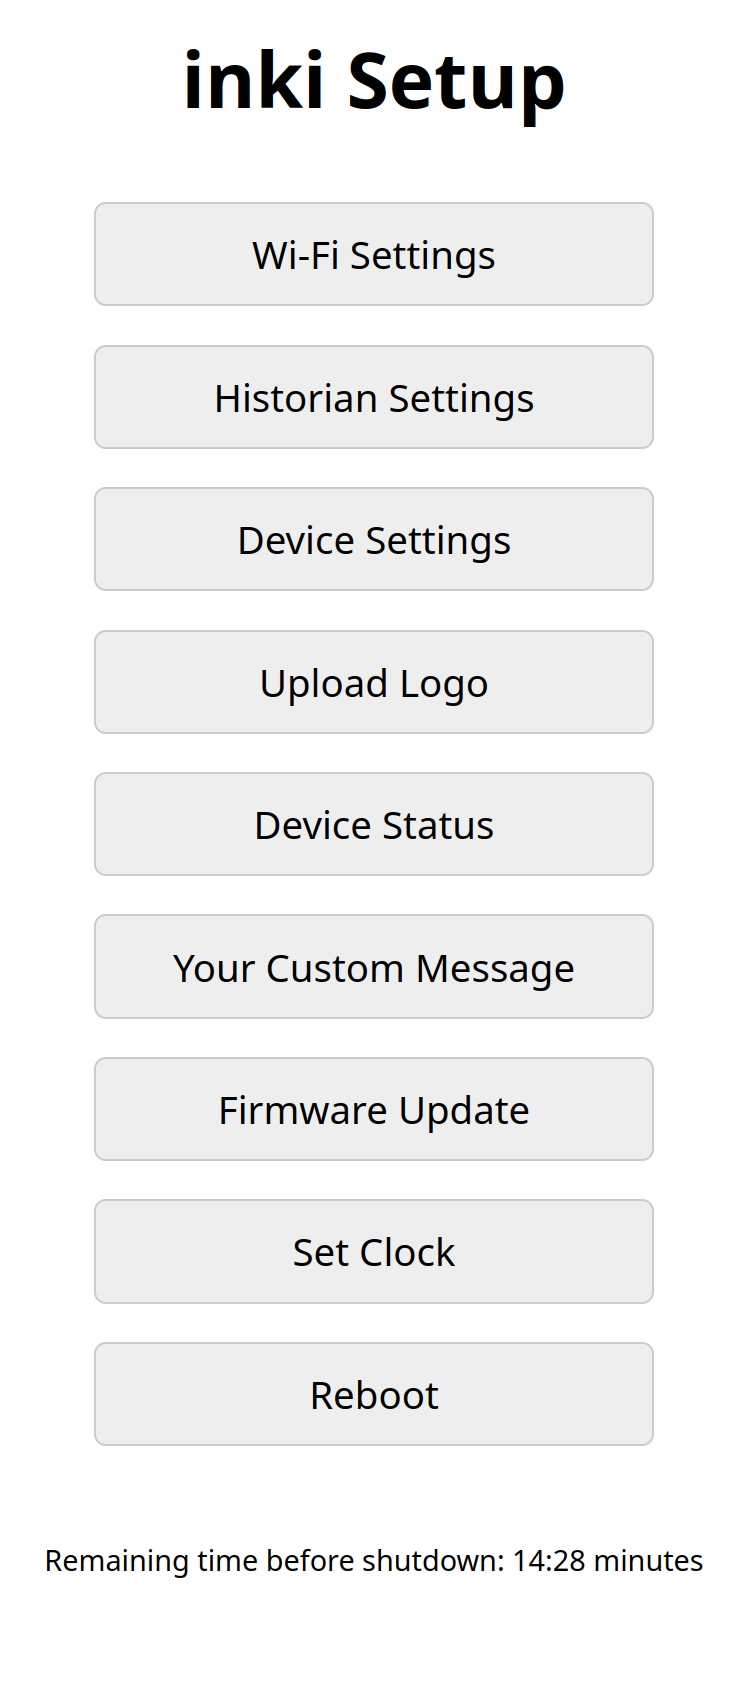
Main configuration screen showing CCU-Historian server settings and sensor data points
Web Interface Setup:
- CCU-Historian server IP and port configuration
- Sensor ID selection and mapping for up to 6 data points
- Update interval scheduling (optimized for battery life)
- Display preferences and graph scaling
- WiFi credentials and network settings
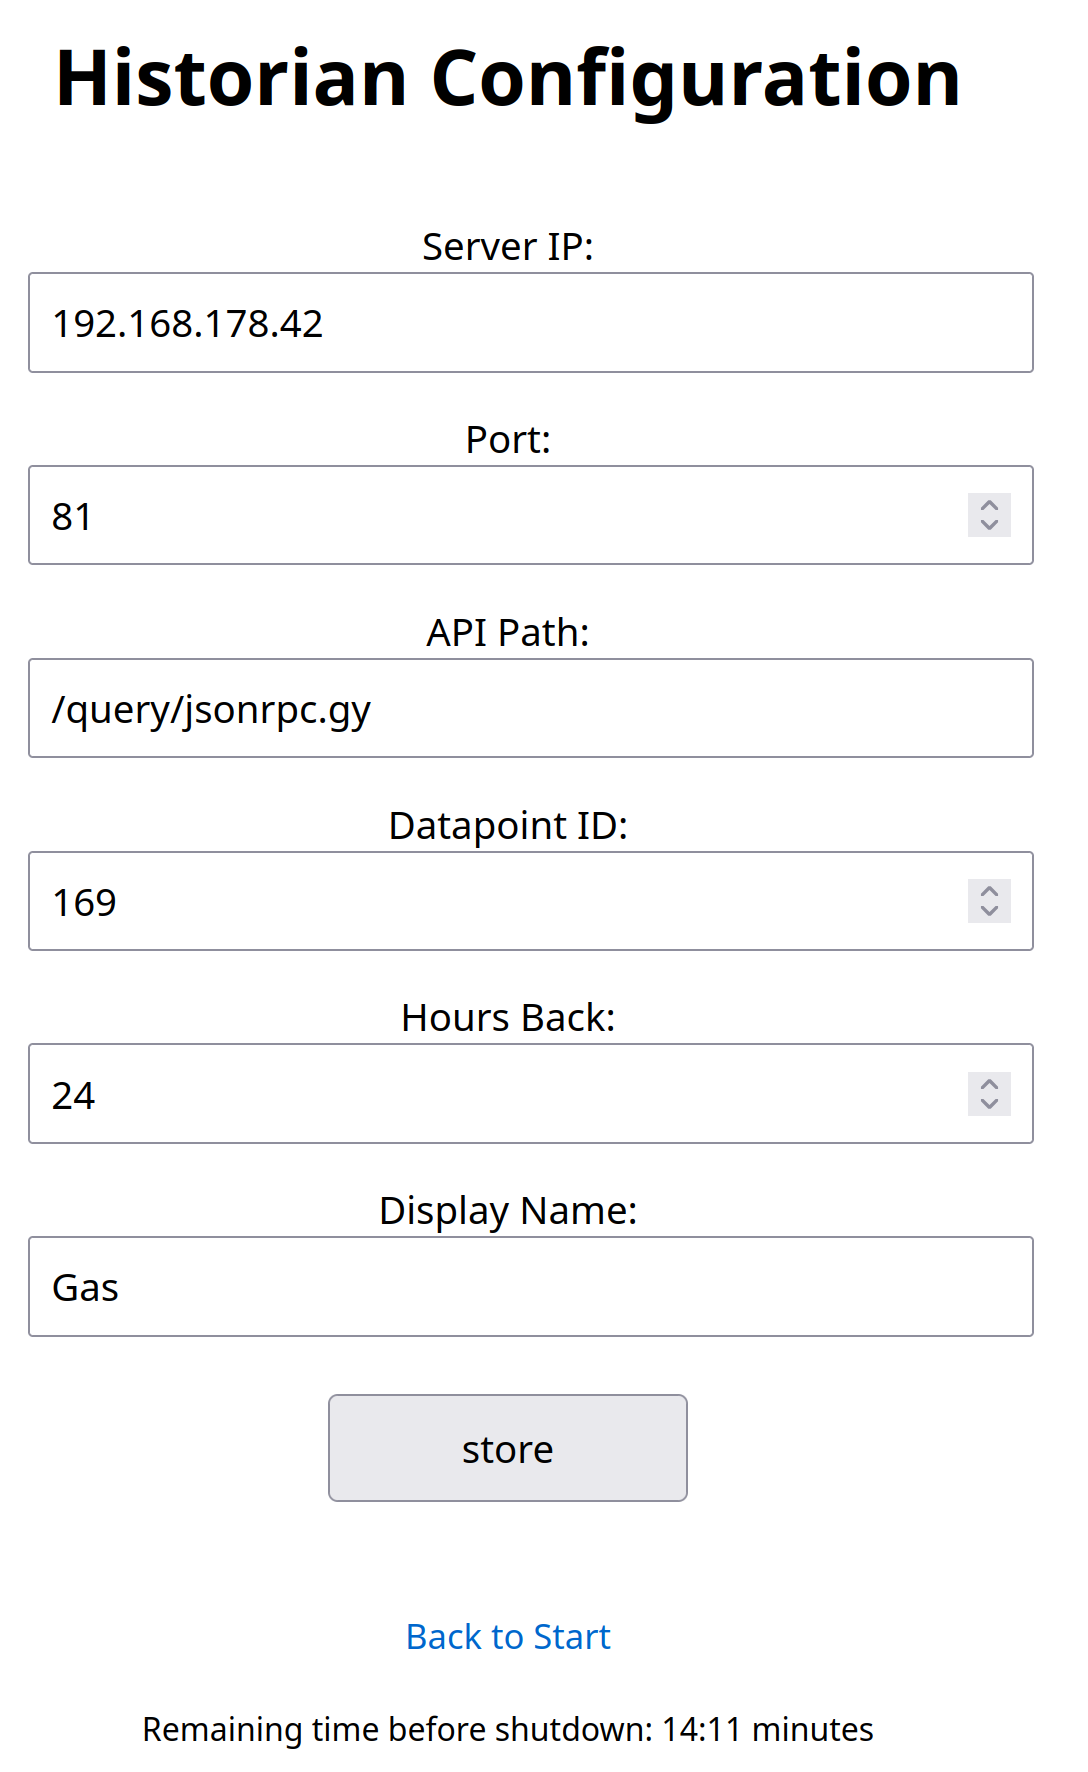
Detailed sensor configuration showing data point IDs and labels for temperature monitoring
Setup Process:
- Connect to the inki setup WiFi network
- Access the web interface at http://192.168.4.1
- Configure your home WiFi credentials
- Enter your CCU-Historian server details
- Add sensor data point IDs from your home automation system
- Set update intervals and save configuration
Firmware Updates:
- Over-the-air (OTA) updates via web interface
- Configuration backup and restore
- Battery status monitoring and alerts
Development Status:
- Core functionality tested and working
- Error handling and edge cases under continuous improvement
- Active development with community feedback integration
Technical Implementation
- Protocol: JSON-RPC API integration with CCU-Historian servers
- Power Management: Complete power-down between scheduled updates
- Wake/Sleep Cycle: RTC-controlled activation at configurable intervals
- Data Processing: Real-time graph rendering optimized for ePaper
- Battery Life: Years of operation depending on update frequency
- Network: Automatic WiFi connection and data synchronization
Questions? Ideas? Interested in a kit?
Contact: c0de@posteo.de